Hydrogen Gas Generation
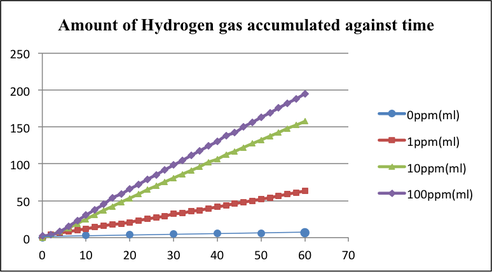
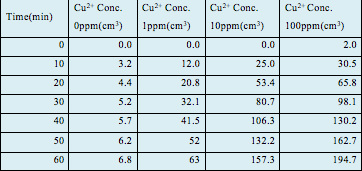
Table 3 Summary of Results from Water Displacement Gas Trap
Figure 8 and Table 3 both show the total hydrogen production by all 4 samples and show the trend of hydrogen production throughout the entire test duration of 60 min. Sample 4, which had 100 ppm of Cu2+, displaced the most amount of water, 194.7 cm3 in 60 min, thus implying that it produced 194.7 cm3 of hydrogen gas as confirmed by the GC-TCD (Gas chromatography-thermal conductivity detector) test conducted afterwards. This was followed by sample 3, containing 10 ppm of Cu2+, with a total production of 157.3 cm3 of hydrogen gas; sample 2, containing 1 ppm of Cu2+, with a total production of 63.0 cm3; lastly, the control containing 0 ppm of Cu2+, with a total production of 6.8 cm3.
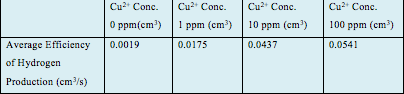
Table 4 Calculations exemplifying the Average Efficiency of Hydrogen Production per unit time
To analyze further, our group has used our results to calculate the average production efficiency of the 4 samples. The results further exemplify that sample 4 with 100ppm of Cu2+ was best able to produce hydrogen, with an efficiency of 0.0541 cm3/s, followed by sample 3 (0.0437 cm3/s), sample 2 (0.0175 cm3/s) and the control (0.0019 cm3/s).
